survival_fig2_384
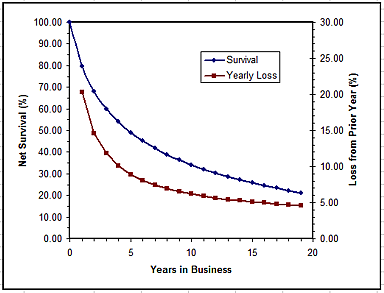
Using the left-hand scale, the blue curve shows the percent of businesses surviving over time. Using the right-and scale, the red curve shows the percent of businesses closing that survived the prior year.
Using the left-hand scale, the blue curve shows the percent of businesses surviving over time. Using the right-and scale, the red curve shows the percent of businesses closing that survived the prior year.
| S | M | T | W | T | F | S |
|---|---|---|---|---|---|---|
| 1 | 2 | 3 | 4 | |||
| 5 | 6 | 7 | 8 | 9 | 10 | 11 |
| 12 | 13 | 14 | 15 | 16 | 17 | 18 |
| 19 | 20 | 21 | 22 | 23 | 24 | 25 |
| 26 | 27 | 28 | 29 | 30 | 31 | |
Copyright © 2006-2026, RamblemuseSM Associates
Ramblemuse Touch Points is proudly powered by WordPress. Page produced with 28 queries in 0.042 seconds.


Leave a Reply